Comparative Genomics and Gene Finding
Written by Genís Parra and Josep Francesc Abril
Introduction
|
|
"Everything is the result of comparisons"
J-F. Champollion at the time in Grenoble in a letter to his brother -- April 1818.
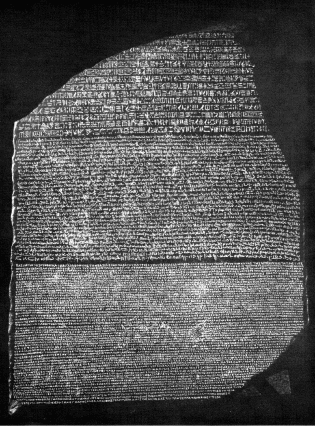
The Rosetta Stone (left figure) was a key piece to decipher the
ancient Egyptian hieroglyphics. The text appears in form of
hieroglyphs (script of the official and religious texts), of Demotic
(everyday Egyptian script), and in Greek.
|
Comparative genomics is the analysis and comparison of genomes from
different species. The purpose is to gain a better understanding of
how species have evolved and to determine the function of genes and
non-coding regions of the genome.
Researchers have learned a great deal about the function of human
genes by examining their counterparts in simpler model organisms such
as the mouse. Genome researchers look at many different features when
comparing genomes: sequence similarity, gene location, the length and
number of coding regions (called exons) within genes, the amount of
non-coding DNA in each genome, and highly conserved regions maintained
in organisms as simple as bacteria and as complex as humans.
 |
 |
 |
|
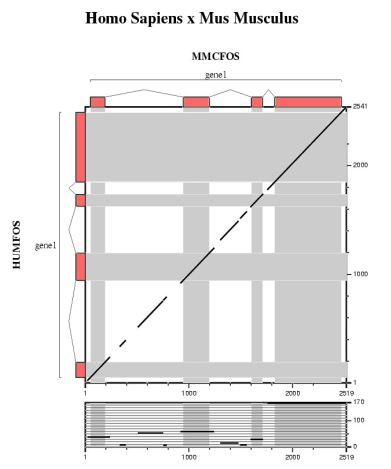
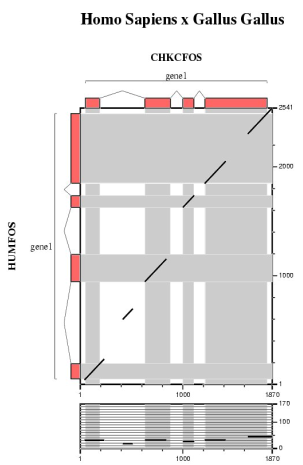
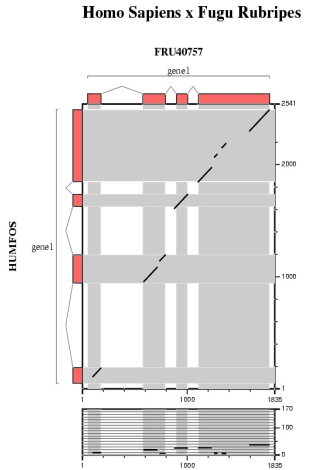
Comparative analysis of the mouse, chicken and fugu orthologs for the human FOS gene.
|
On the other hand, finding similarities is not as much important as
finding differences. The comparative approach also points out those
features which are unique for a given phylogenetic group or
particularly a species. Species specific functions can be involved in,
for instance, pathogenicity, resistance to antibiotics, and so on, but
also will result on more complex phenotypic characters such as the
human ability to speak.
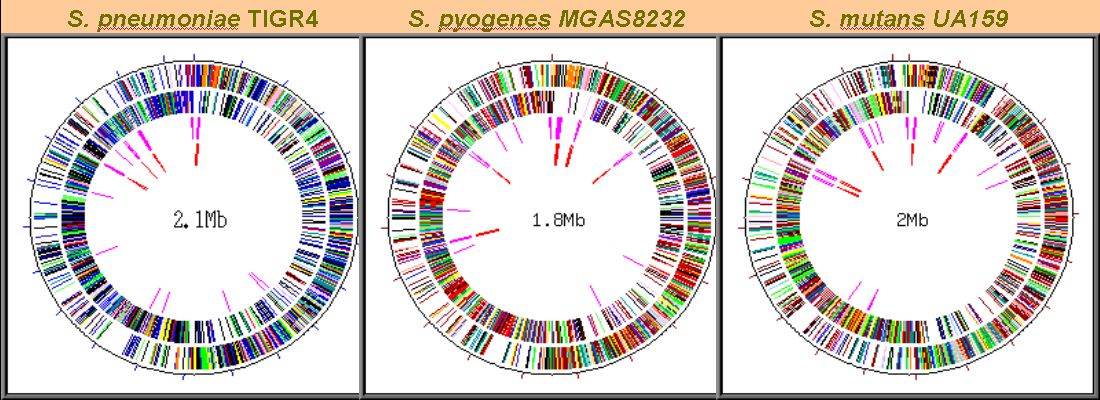
Visualizing the complete catalog of genes for three Streptococcus species.
Ab initio gene finding programs integrated different measures
obtained from the raw genomic sequences, such as G+C content,
periodicity of coding regions, exon bounds signal detection,
etc. The obvious next step was to include homology from the growing
annotation databases like SWISSPROT and EMBL/GenBank.
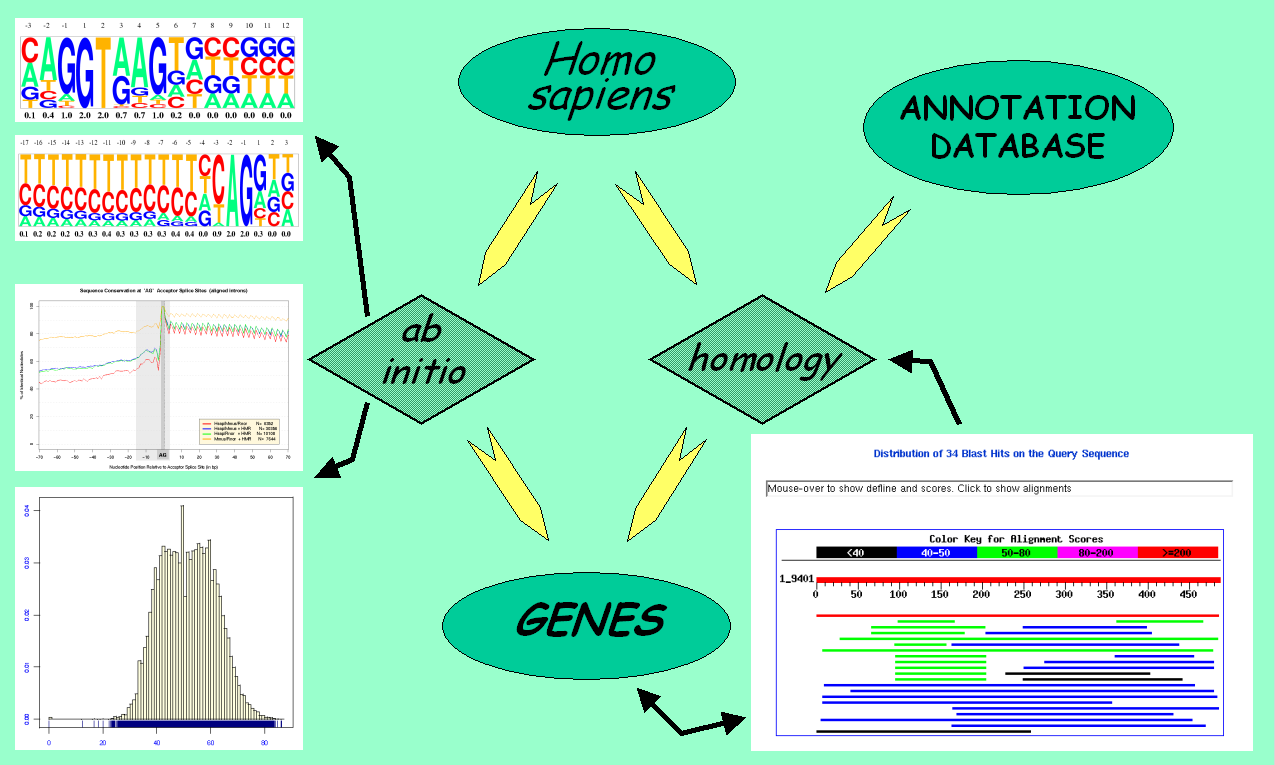
General schema of an ab initio gene prediction tool.
Modern gene prediction programs can integrate the data obtained from
the comparison of two genomes to improve the exonic structure of already
predicted genes. Furthermore, novel genes not represented in the
annotation databases can be found as well.
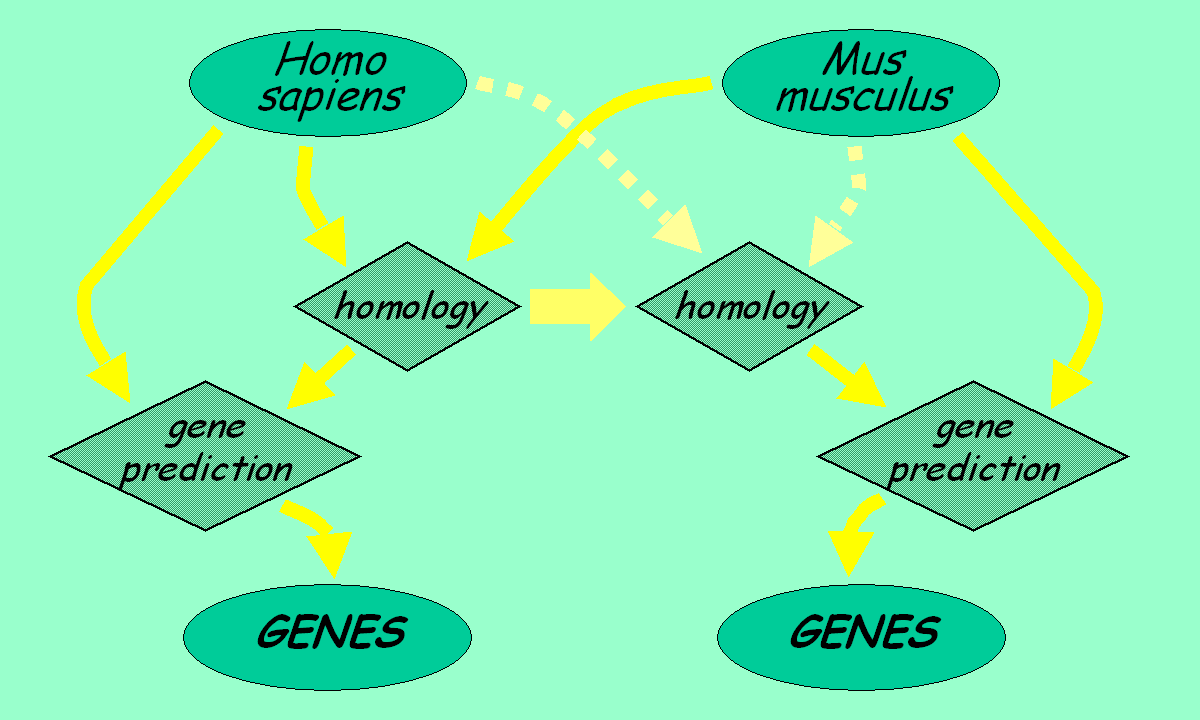
The comparative gene prediction approach can produce a complete gene set for both species.
Before we start this practical on comparative gene-finding tools lets review some important concepts. Any of the following links will help us to illustrate some of them: Ensembl Synteny View of Chromosome 7, NCBI Homology Map of Chromosome 22.
- Conserved
- Derived from a common ancestor and retained in contemporary related species.
- Homologs
- Features in species being compared that are similar because they are ancestrally related.
- Orthologs
- Homologous features that separated because of a speciation event, they derive from the same gene in the last common ancestor.
- Paralogs
- Homologous features that separated because of duplication events.
- Synteny
- The property of being on the same chromosome.
- Homology Blocks
- Also defined as Conserved Synteny, occurs when the orthologs of genes that are on the same chromosome in one species are also on the same chromosome in the comparison species.
- Conserved Segments
- Also known as Conserved Linkages, is a special case of the conserved synteny in which the order of multiple orthologous genes is the same in the compared species.
|
Overview
In this section we will run several ab initio gene prediction
programs on a particular genomic DNA sequence and we will compare the
results against predicted genes from a gene finding program that uses
genomic homology. For each of these programs we will obtain a prediction of
a candidate gene and we will analyze the differences between
predictions and the annotation of the real gene both in human and
mouse.
The programs we are going to use are geneid, genscan
and fgenesh, which have been used in the previous practical
exercise. blast will be used to compare human and mouse
sequences. Then, sgp2 (syntenic gene prediction tool) will
predict genes taking into account the homology found between these two
species. Finally, we will take a look at comparative tools that are based
on the sequence alignment rather than on the gene prediction paradigm.
A Genomic DNA Sequence
We are going to work with this
Human sequence, which is stored in FASTA format. We also provide
the homologous region in the mouse genome in this
Mouse sequence.
Ab initio Gene Finding
In the first approach, we will use all the ab initio tools
from the Gene Prediction section and compare the result of the three
programs. You could open a simple word processor and paste the results
of each gene-finding program in order to compare the coordinates of the
predicted exons.
Step 1.-
Analyzing the Human sequence.
In order to use geneid follow these steps:
- Connect to the geneid server by following
this link.
- Paste the DNA sequence.
- Select organism (human).
- Finding genes: You do not need to select any option (default behavior).
In order to use genscan follow these steps:
- Connect to the genscan server by following
this link.
- Paste the DNA sequence.
- Select organism (vertebrate).
- Run gene predictions.
In order to use fgenesh follow these steps:
- Connect to the fgenesh server by following
this link.
- Paste the DNA sequence.
- Select organism (human).
- Run gene prediction.
Some questions:
- Do the ab initio gene finding programs predict the same exonic
structure ?
- How many common exons the different programs have predicted ?
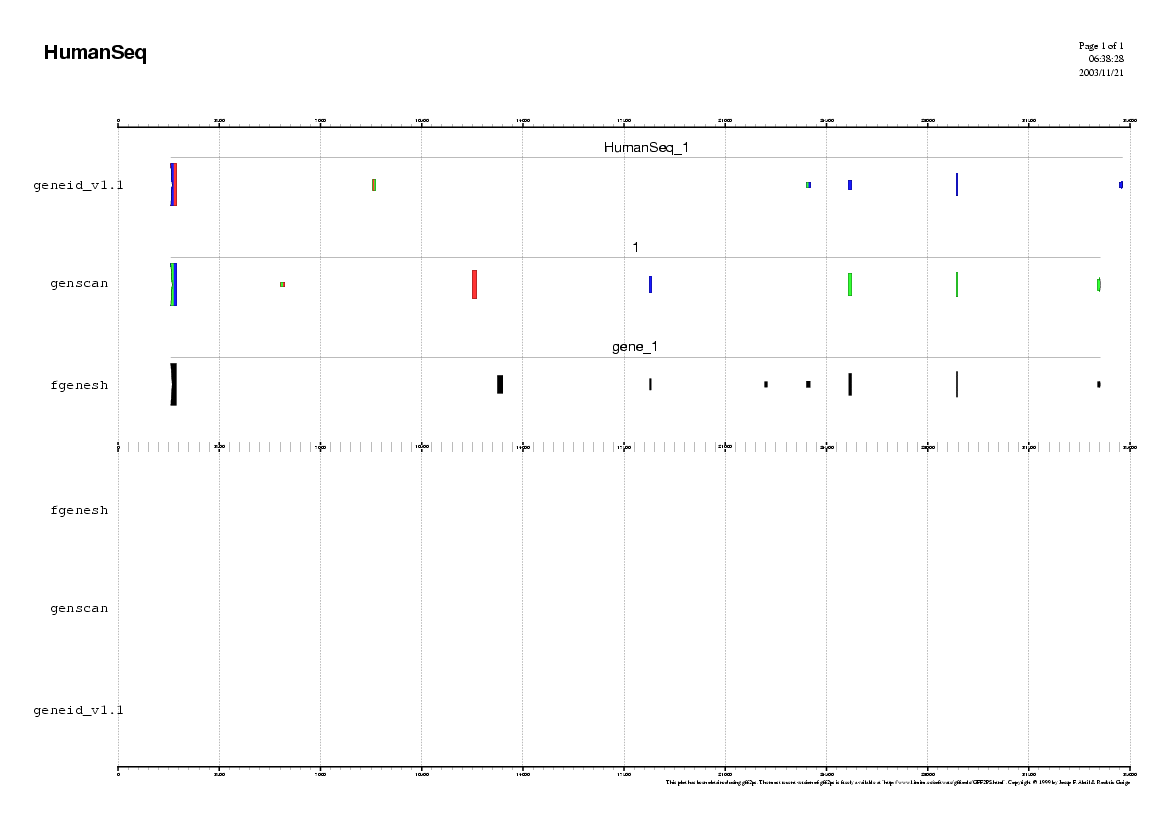
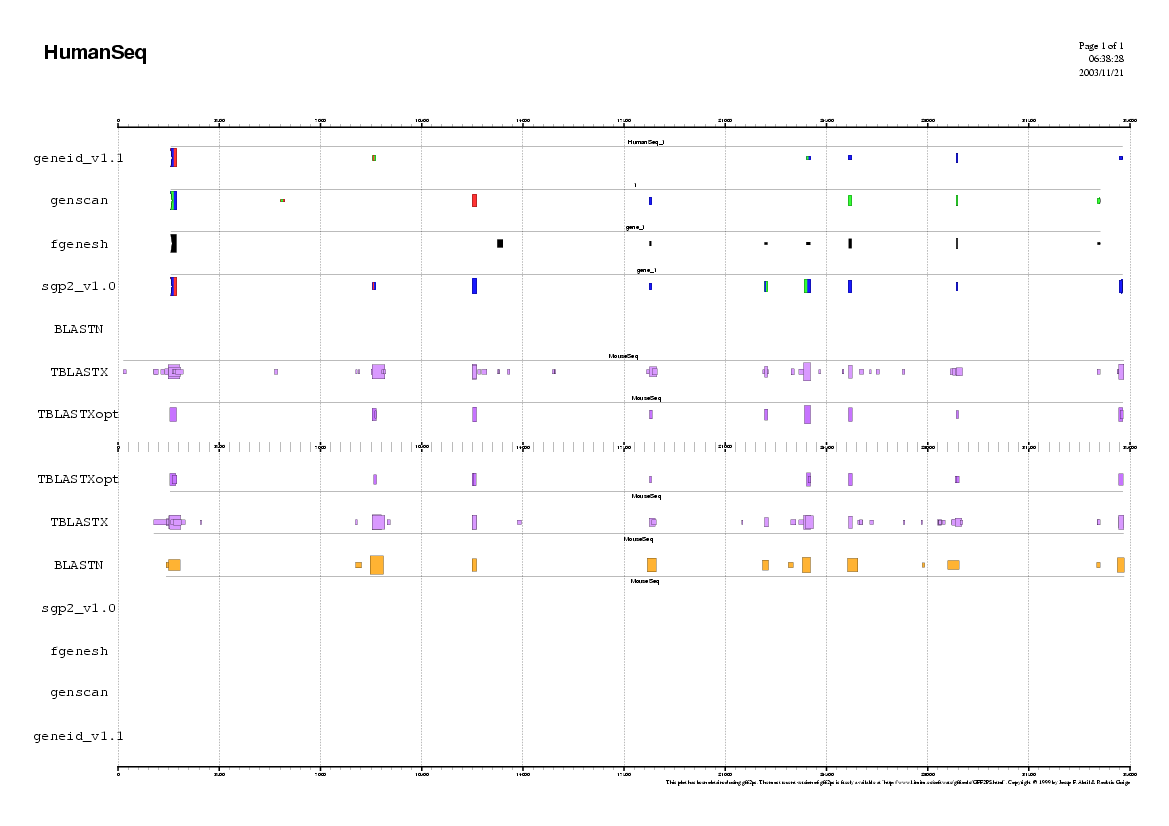
Here you can find a plot with the predictions of the ab initio
gene finding tools in the human genome.
Step 2.-
Now, make the prediction in the Mouse sequence, with all the ab initio
programs.
Some questions:
- Do the ab initio gene finding programs predict the same exonic
structure ?
- How many common exons the different programs have predicted ?
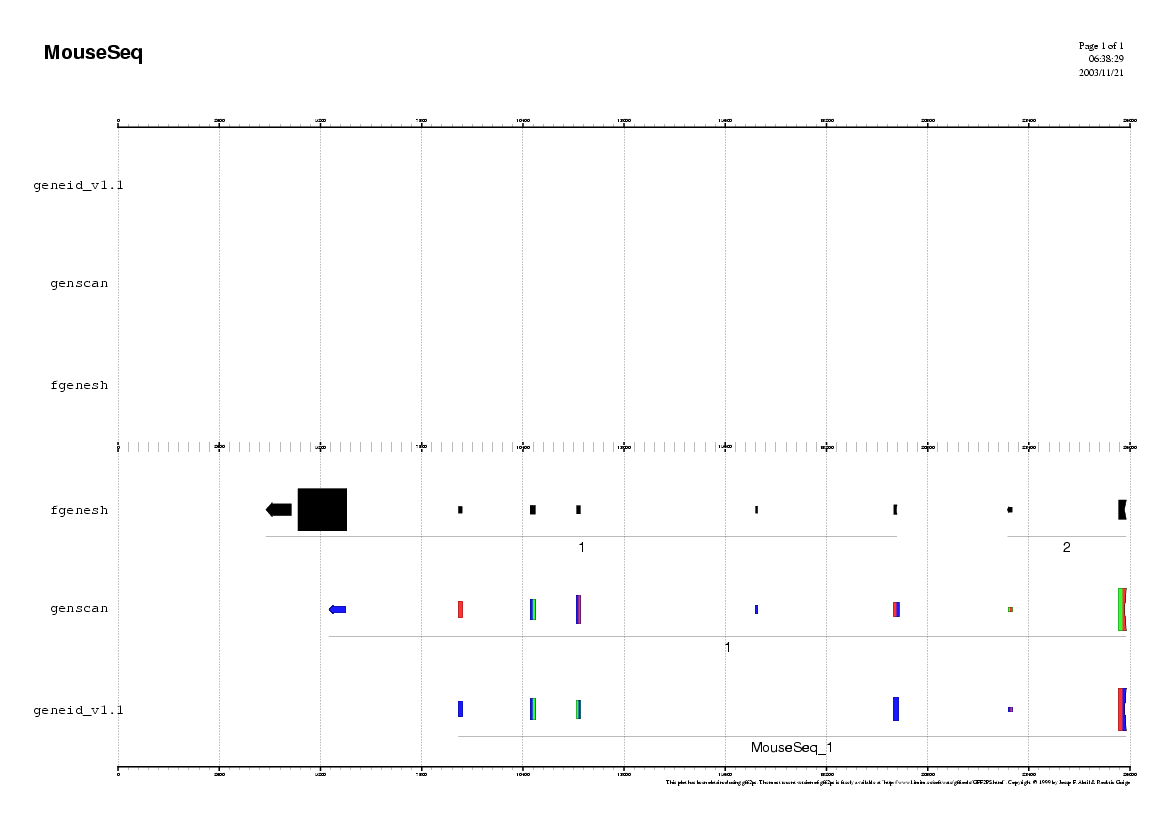
Here you can find a plot with the predictions of the ab initio
gene finding tools in the mouse genome.
Do you find any common pattern between human and mouse prediction ?
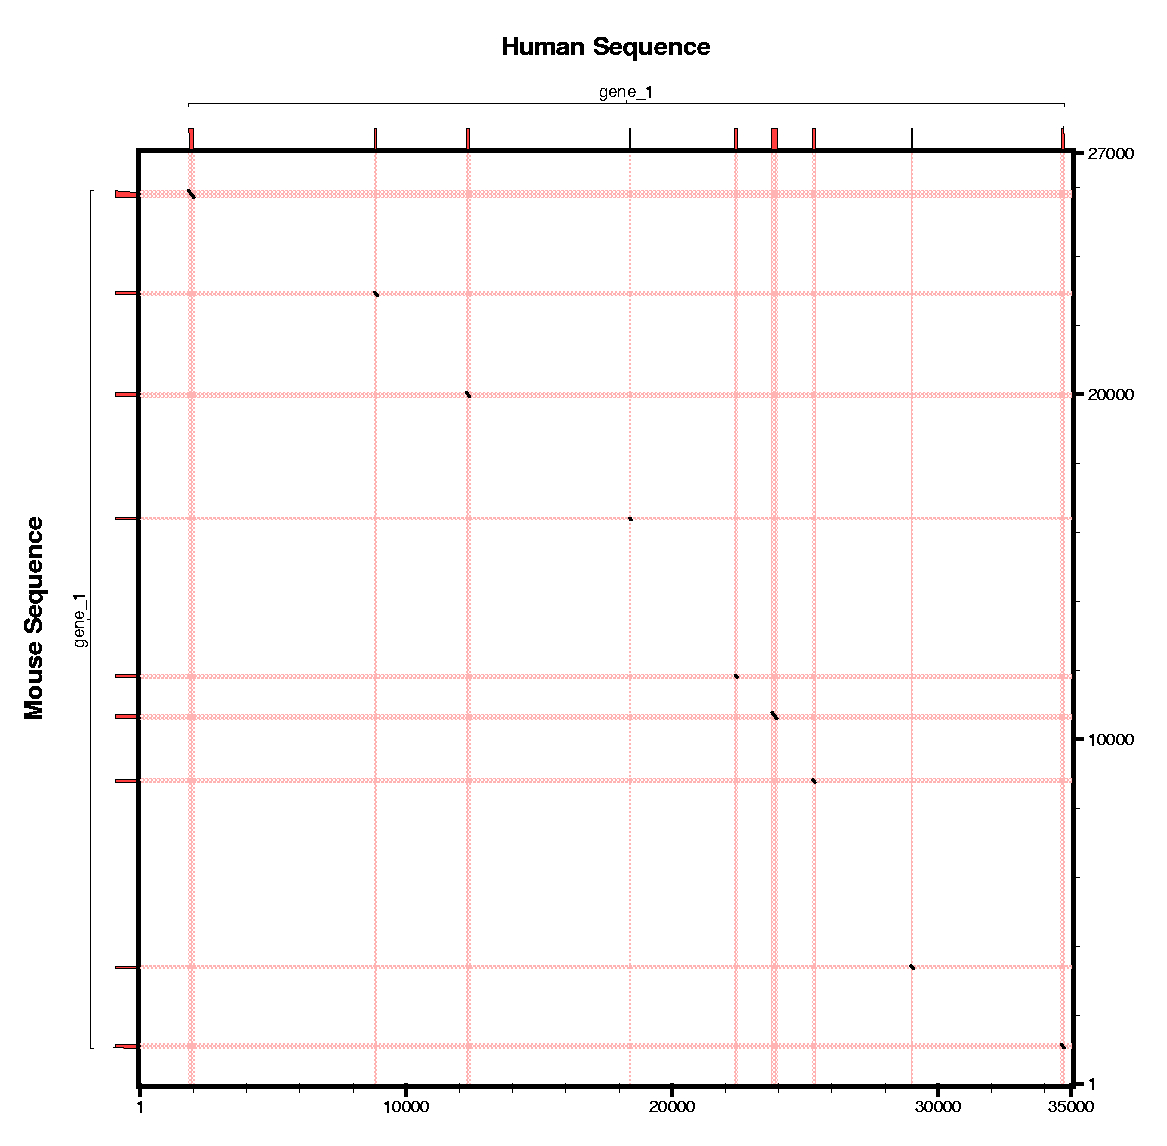
Comparing Human and Mouse Sequences
In this section we will compare the human and the homologous mouse
sequence using blastn and tblastx on the NCBI's
server. Blastn compares a nucleotide query sequence against a
nucleotide sequence database and tblastx compares the
six-frame translations of a nucleotide query sequence against the
six-frame translations of a nucleotide sequence database.
Some questions:
- Where do you expect to find more similarity regions hits ?
- Which program do you think is more sensitive ?
Met Tyr Iso Ser Pro Asp
ATG TAT ATC TCT CCC GAC
||| | |  ||     ||  | |
ATG TTT CTC AGC CCT GCC
Met Phe Leu Ser Pro Ala
                         Amino Acid Level Score
+6  +3  +2  +4  +9  -2      Blosum45    :  +22
+++ +-+ -++ --- ++- +-+  Match/Mismatch :   +4
                         Nucleotide Level Score
In order to use blastn follow these steps:
- Connect to the Blast2Sequences server by following
this link.
- Select blastn in the program box.
- Paste the Human sequence in the "Sequence 1".
- Paste the Mouse sequence in the "Sequence 2".
- Align.
In order to use tblastx follow these steps:
- Connect to the Blast2Sequences server by following
this link.
- Select tblastx in the program box.
- Paste the Human sequence in the "Sequence 1".
- Paste the Mouse sequence in the "Sequence 2".
- Align.
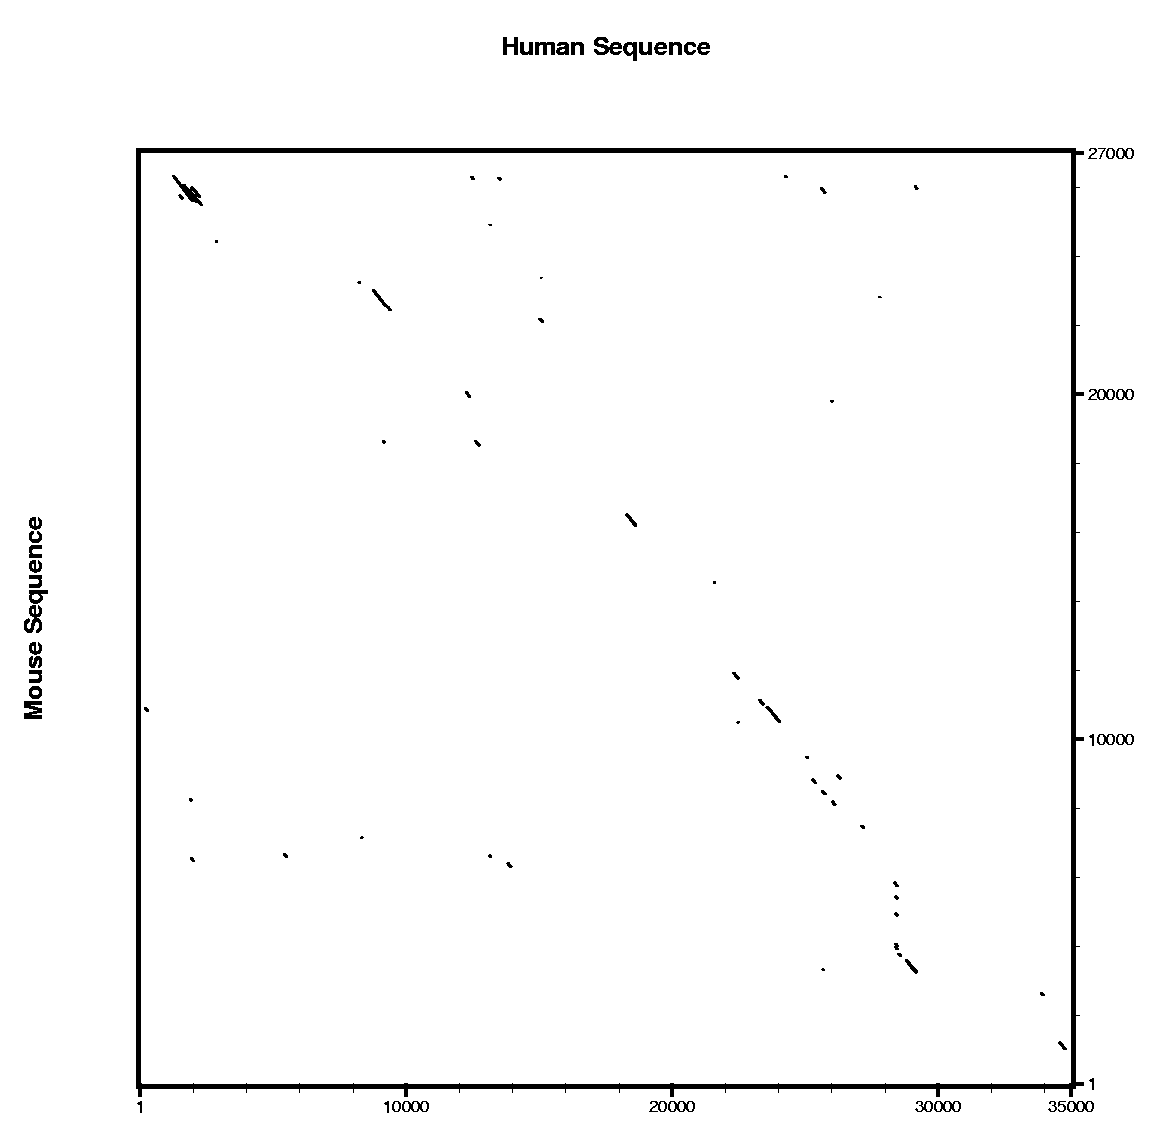
Are all the predicted exons supported by conserved regions ?
Here you can find a plot with the alignment results of the blastn and the tblastx alignments.
There are several programs to align and visualize pairs of large genomic
sequences, for instance: gff2aplot, Vista and
Pipmaker.
Using Comparative Gene Finding Tools
In this section we will use sgp2 to make the predictions
using the conservation pattern between human and mouse.
In order to use SGP2 follow these steps:
- Connect to the sgp2 server by following
this link.
- Paste the Human sequence in the "Sequence 1".
- Paste the Mouse sequence in the "Sequence 2".
- Select Homo sapiens vs Mus musculus parameters.
- Select Prediction in both sequences.
- Select geneid output format.
Some questions:
- Are human and mouse predictions similar using sgp2 ?
- Does any of the ab initio predicted exons match sgp2 predictions ?
- Does the similarity regions found by tblastx match sgp2 predictions ?
Here you can find the human predictions, the
mouse predictions and the human and mouse predictions with the
tblastx similarity regions.
| 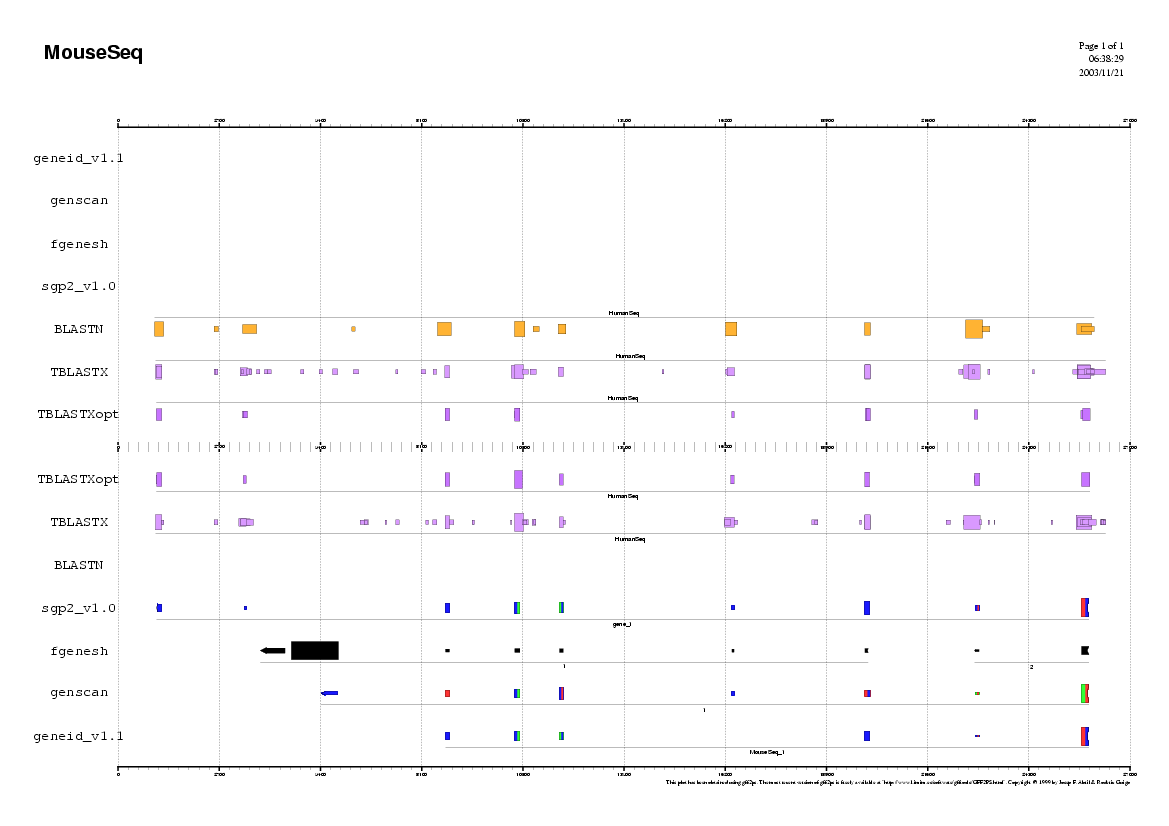
| 
|
| Human (using mouse) |
Mouse (using human) |
Human and mouse
(using tblastx) |
There are other program that uses genomic comparison to improve gene
prediction: twinscan and slam.
Current Annotations in the Genomic DNA Sequence
Go to the UCSC genome browser
, and look for the annotation of this region in the human
genome. Open another web browser window and look for the annotation of
the mouse sequence in the mouse genome annotation.
The predictions we have obtained, are they consistent with the annotation of
the UCSC genome browser ?
Here you can find a plot sumarazing annotations from human and mouse.
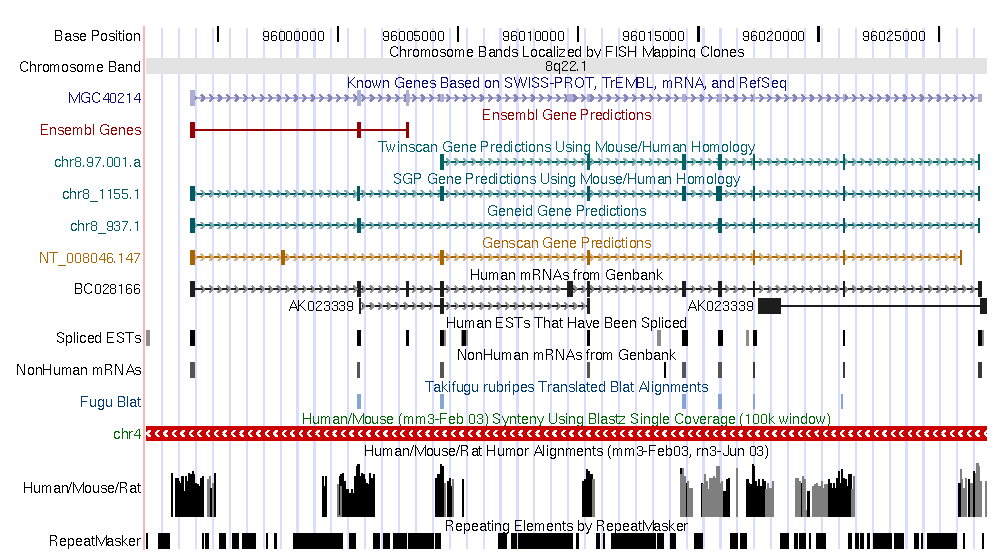
| 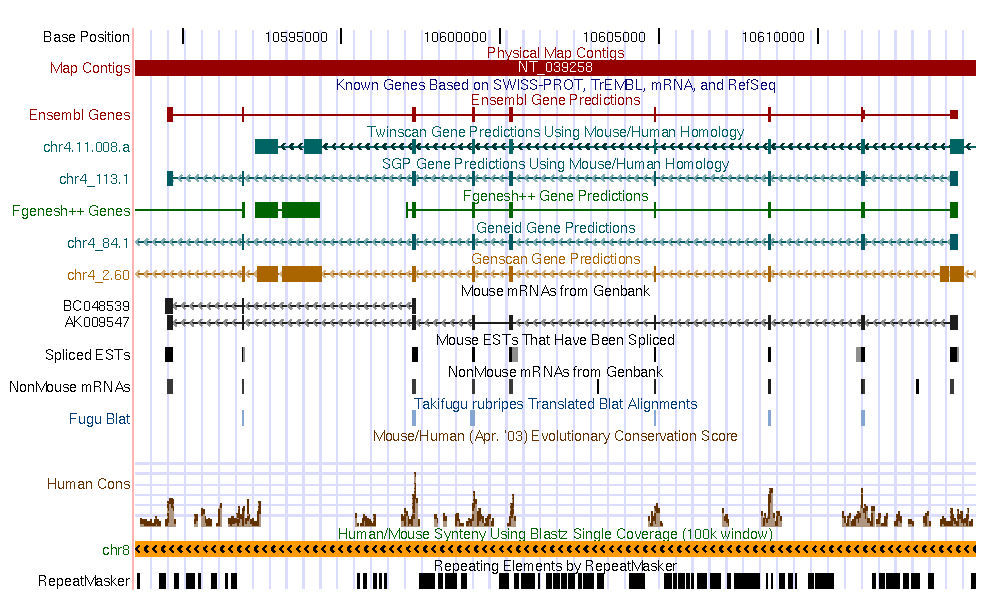
|
| Human annotations |
Mouse annotations |
Sequence Alignment and Comparative Genomics
Comparative analysis of DNA sequences from multiple species at varying evolutionary distances is a powerful approach for identifying coding and functional non-coding sequences, as well as sequences that are unique for a given organism. Here we will survey few of such tools.
Two well established programs, Vista and Pipmaker, will provide the best results. They are not easy to use as they require several input files, each having different formats, to obtain highly customized outputs, as it is illuastrated in the figure below (from Frazer et al, Genome Research, 13(1):1-12, 2002; by the way, a must read review).
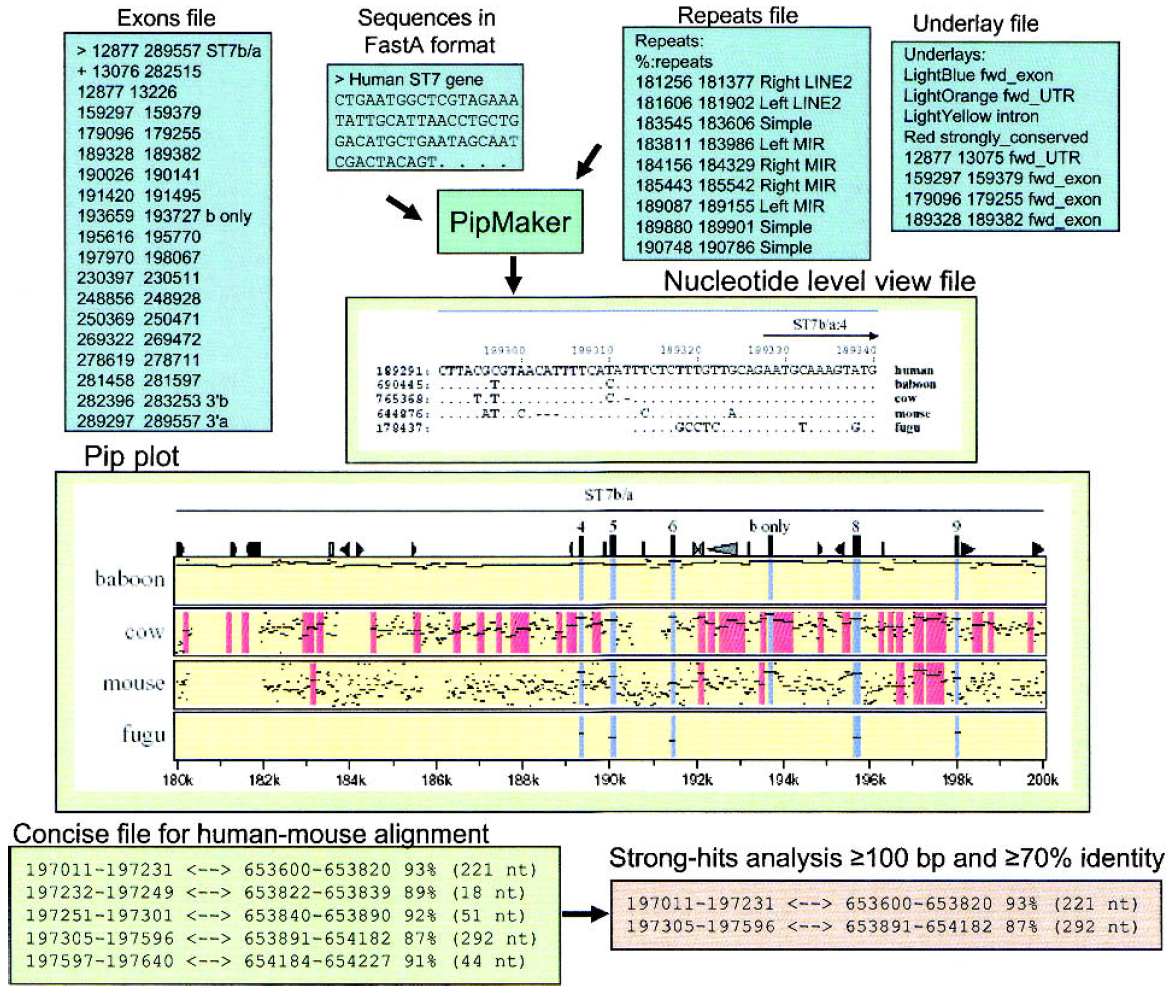
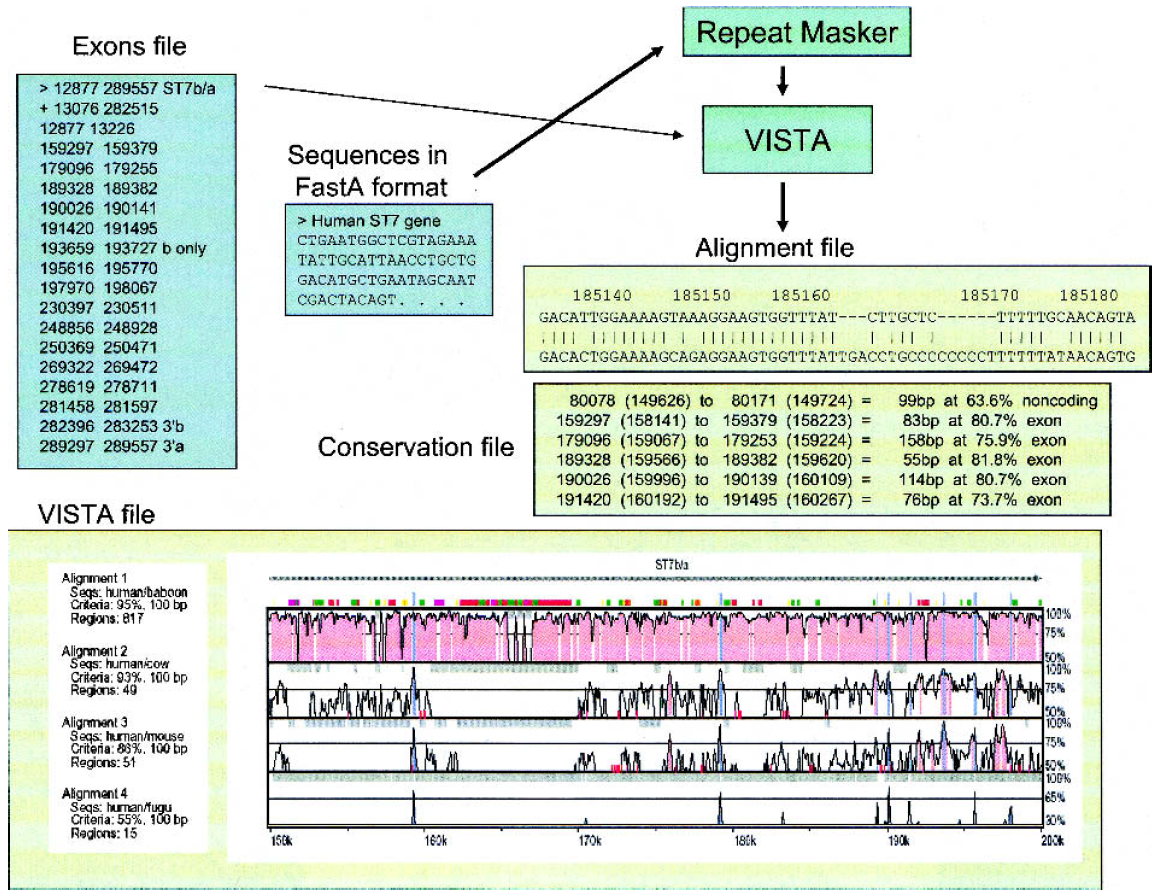
Input and output files for Pipmaker (left) and Vista (right).
More intuitive and user-friendly tools with similar capabilities have appeared recently, the most remarkable ones being the ECR-Browser, zPicture and eShadow (all three from the Comparative Genomics Center at Lawrence Livermore National Laboratory). The following figure illustrates the differences between pip- and smooth-plots.

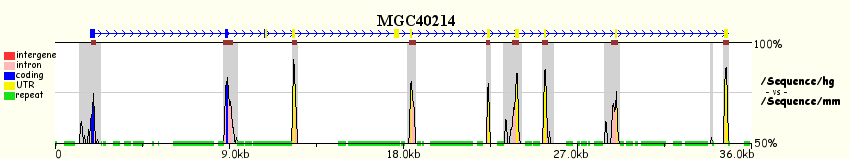
Output from zPicture: Human hipotetical protein MGC40214 (RefSeq Id NM152416) genomic region
from human chromosome 8, compared against its mouse orthologous region. Upper panel shows
a pip-plot (PipMaker like), while the bottom panel visualizes the same data with a smooth-plot (VISTA like).
Finally, we will see two web browsers that have been developed from the comparative genomics standpoint. You can follow the link to the K-Browser and the MultiContigView from Ensembl browser.