|
In this practice, a weight matrix computed in
P. Bucher. Journal of molecular biology 212: 563-578 (1990),
from sequences containing real TATA-boxes will be obtained by accessing to
the TRANSFAC database and reading the corresponding entry. Then, this matrix
will be used to scan for putative TATA boxes in the input set of promoter regions.
|
ADVICE: It is very useful to open 2 or more browser windows, preserving this
text in one of them and running the exercise using another one.
Input sequences:
6 genes of Drosophila melanogaster.
WWW tools:
Regulatory Sequence Analysis Tools (RSA) by Jacques van Helden
from SCMBB - Service de Conformation des Macromolécules Biologiques et de Bioinformatique (Université Libre de Bruxelles).
TRANSFAC database, the transcription factor database.
Step 1: Access TRANSFAC to acquire the TATA box entry
- Connect to TRANSFAC database.
- Click over the Search link.
- Click over the Matrix button.
- Set Table field to search in: to All fields
- Type TATA in the text area. and then, submit the query
- Click over M00252 and have a look at the description (don't close the window)
- Repeat the same process with the Factor collection. Select the factor T00794.
Where is the link for accessing the matrix from the factor entry? Hint: Lines starting with
MX.
Step 2:Use the matrix to find TATA-boxes in a set of promoter regions.
- Read the promoter regions in fasta format.
- Connect to RSA tools server.
- In the menu (left frame), click over Pattern matching: patser (matrices).
- Copy and paste the TRANSFAC matrix (TATA box, including the header PO A C G T)
into the Matrix box.
- Select transfac in the Format (matrix) selector.
- Copy and paste the promoter regions into the Sequence box.
- Choose "single" in the Search strands selector.
- Press the button Go to submit the query.
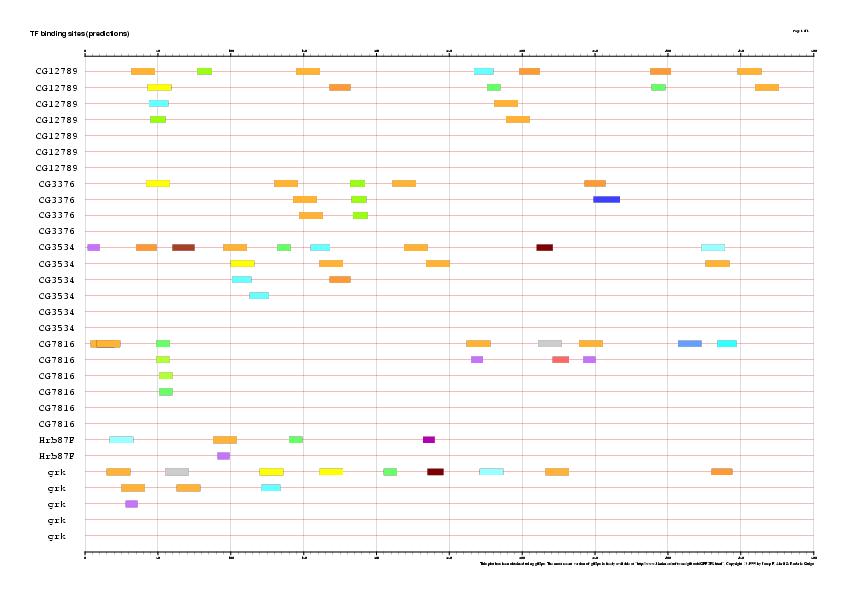
- Press the button Feature map to enter
a new menu about plotting the results.
- Click the button Go to obtain
a graphical output of the reported matches.
- Now repeat the process, but selecting "weight" in the Lower
threshold estimation selector. Set up the threshold to 0. Notice the huge number of candidates
you obtain. Increase the threshold to 3 to reduce the number of predictions.
Questions:
- Which conclusion can you extract from the plot? Some regions are predicted to contain more than
5 TATA boxes while zero or one are supposed to happen in real genes. Perhaps, increasing the threshold
a smaller amount of results will be predicted.
Results:
TRANSFAC possess its own program to scan promoter regions using the available
collection of matrices (MATCH).